Loading
Back to writing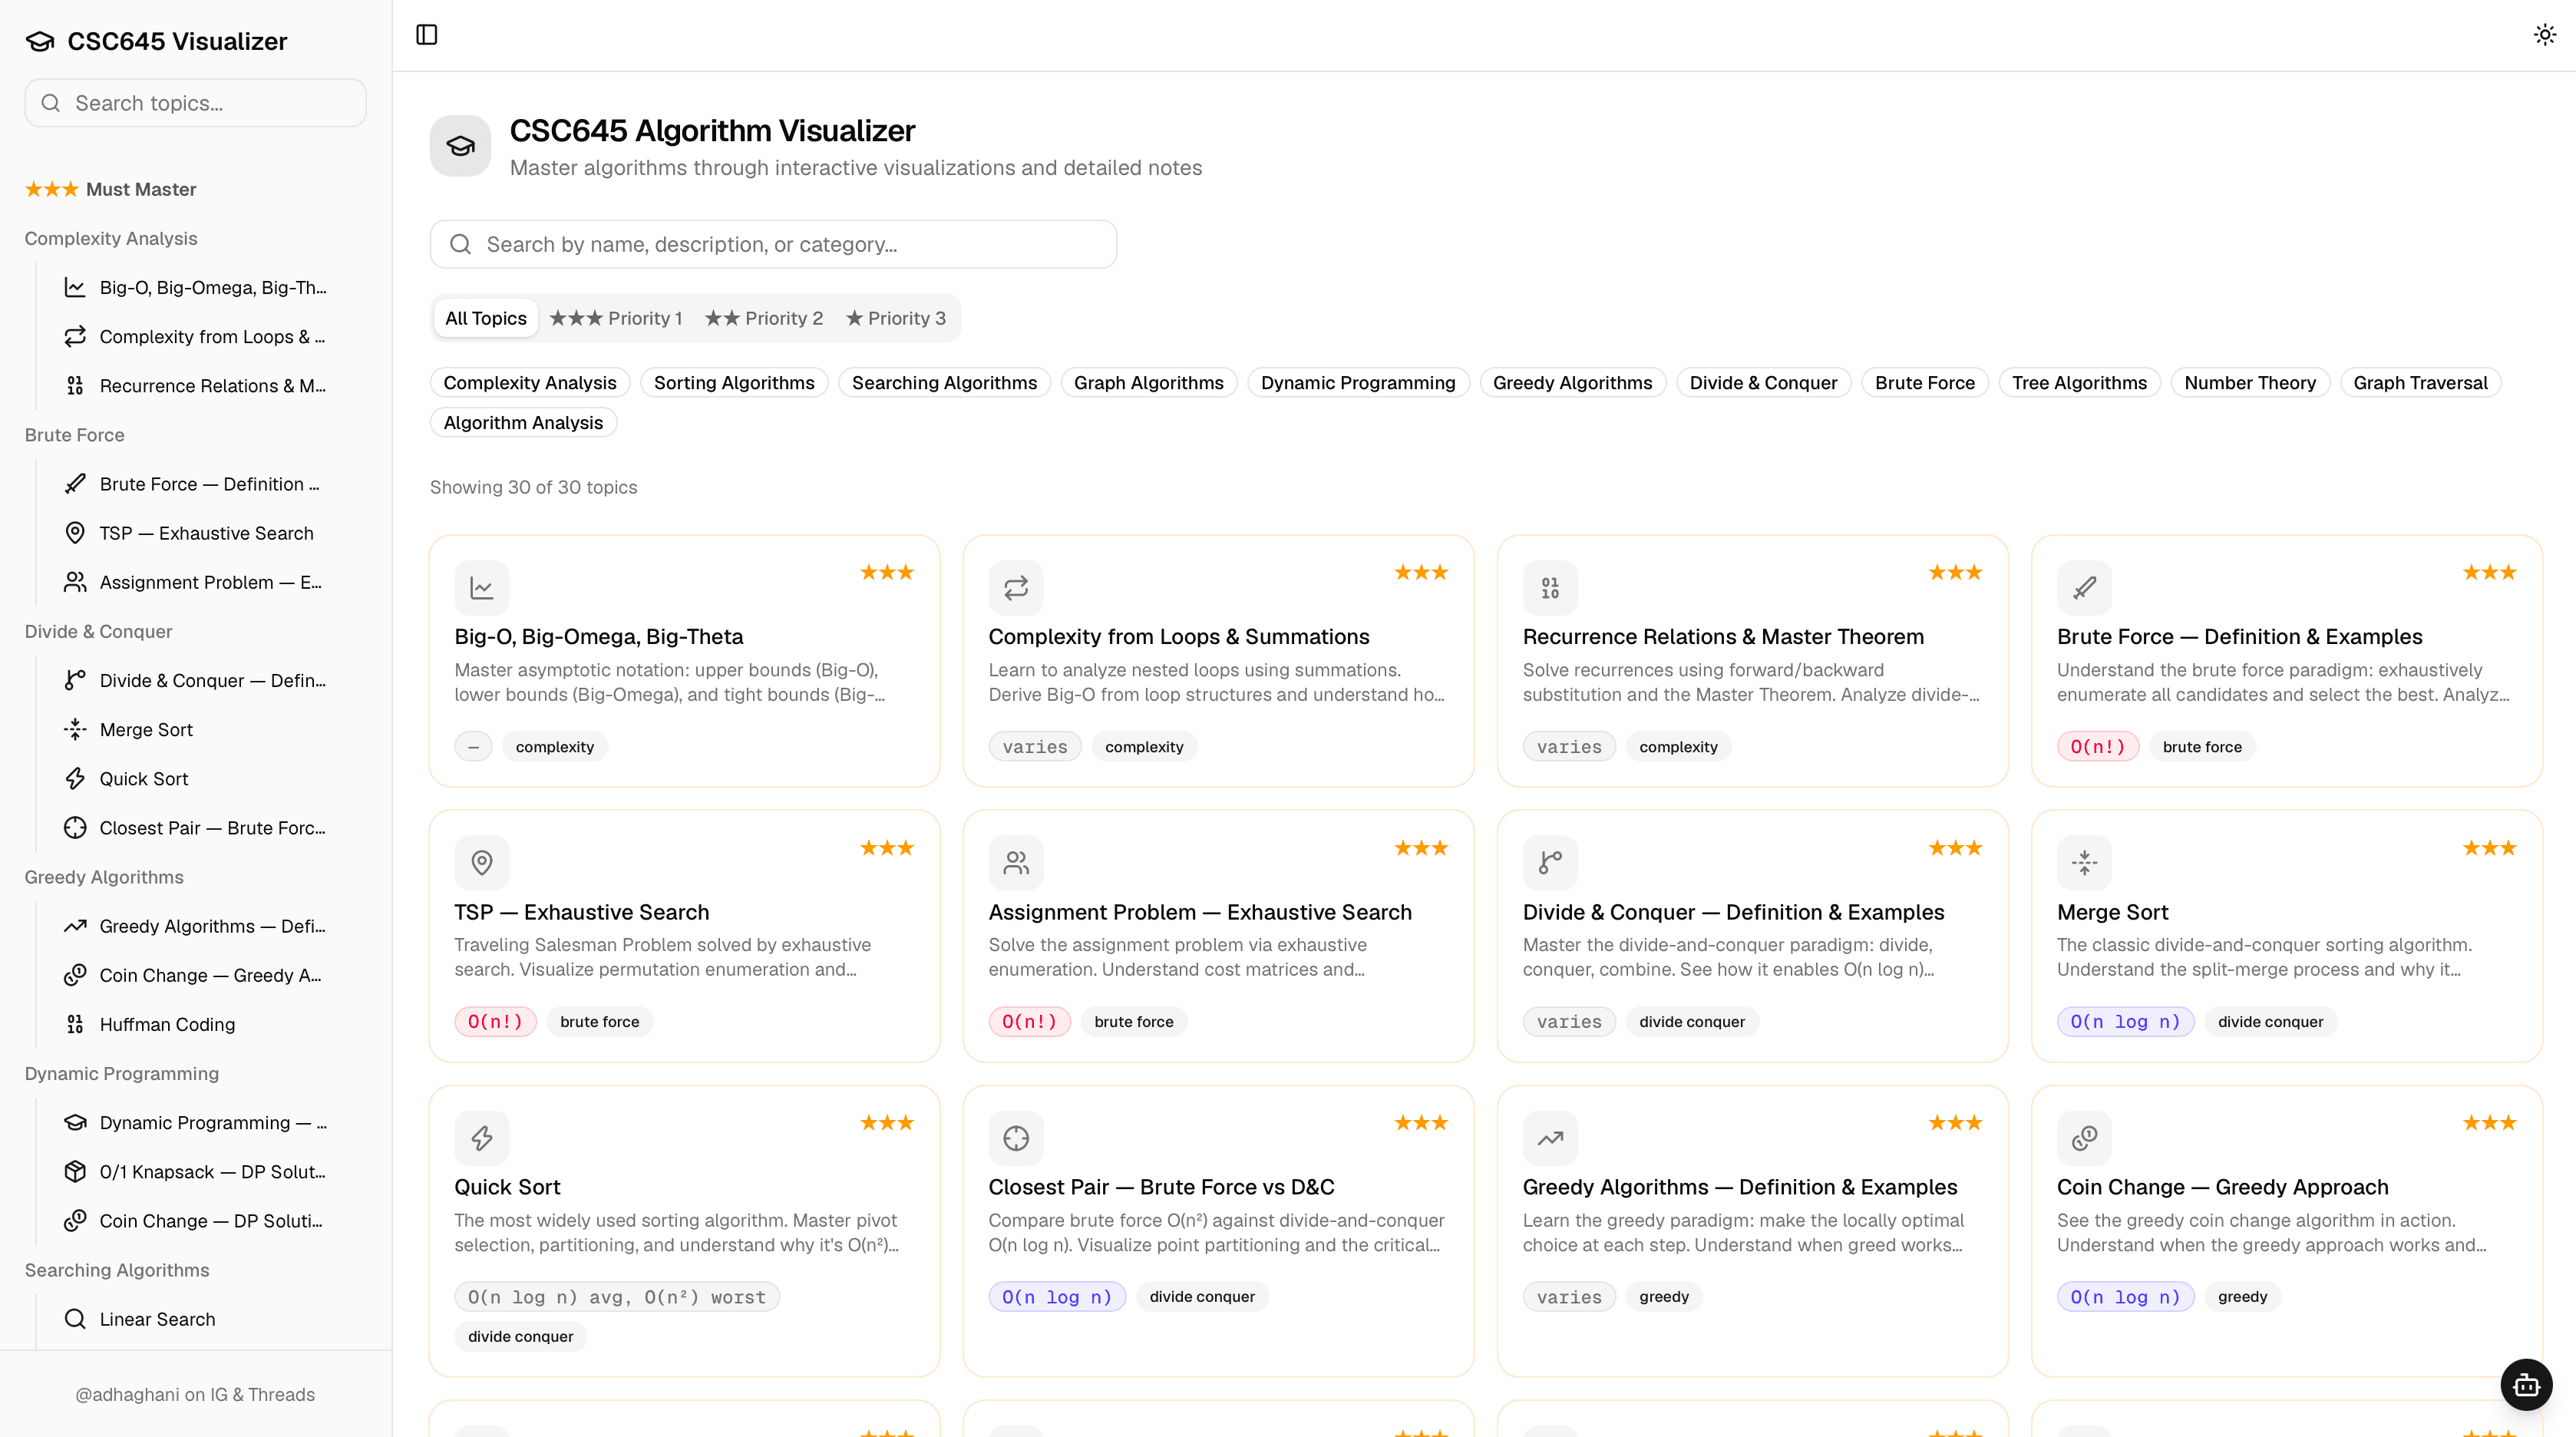
Project That Help Others.
1 min read
Recently I had my final exam on algorithm analysis and design. and to cope with the 100s of pages of slides, I vibe coded a small web-based notes to help me visualise graph algorithms like Kruskal’s, Prim’s, and Floyd-Warshall because reading through all those lecture slides just wasn't clicking.
Turns out visual learning goes a long way. My friends started using it too, and it’s made grasping these concepts so much easier for all of us.
Sometimes the best way to understand a complex concept is to visualise your way through it, and I felt proud that my friend used it too.
#development#code#project